The COVID-19 crisis has continued to evolve rapidly over these last few weeks and drive substantial impacts to the grocery retail industry. As Pensa continues to capture real-time shelf data across a number of categories and geographies, we have a unique vantage point on what is happening. A little more than a month after the U.S. declared a national emergency, Pensa’s tracking of three different popular product categories – cough & cold medicine, cereal and beer – illustrates varying timing, patterns and levels of both impact and recovery as retailers and brand manufacturers strive to adjust to daily supply chain realities as well as rapidly shifting consumer preferences.
Take a look at the visual above. These snapshots were taken at roughly the same time in different parts of the country: the cough & cold aisle in New York City drugstores, cereal in Los Angeles area grocery stores, and cold beer in Manhattan. The patterns vary greatly by product category and store location.
Let’s take a more detailed look at what our autonomous perception systems are seeing in each situation. First up: the cough & cold aisle, Midtown and lower New York City.

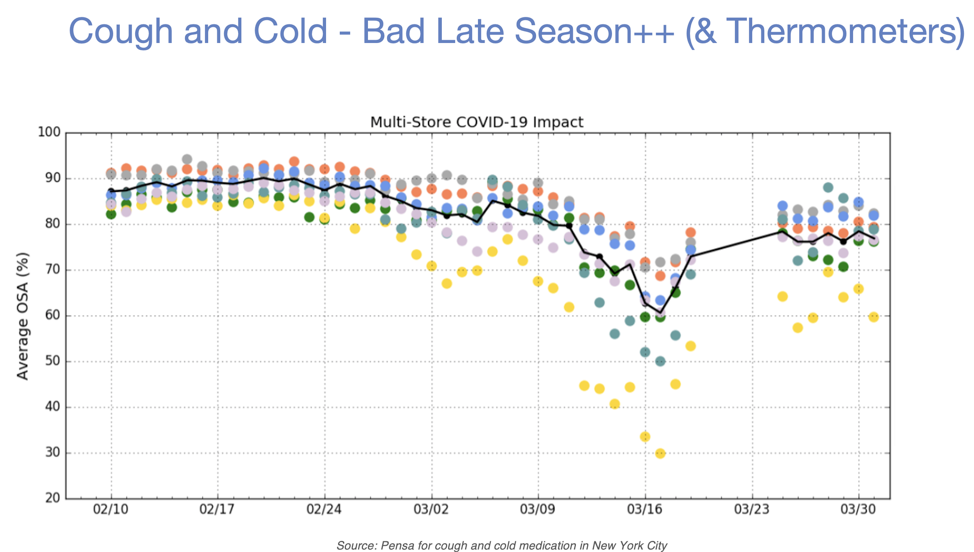
This aisle includes cough medication, pain relievers and thermometers and is a category used to seasonal surges as illness outbreaks ebb and flow. By this time, in a normal season, retailers would start to stock more allergy medication with the onset of Spring. But this year, as the news of the growing COVID-19 crisis began and continued, you see the effects of a continued steady demand increase as OSA levels drop slowly, then more rapidly after the emergency declaration and shelter-in-place orders go into effect.
On a product-level, our more detailed analysis showed thermometers and humidifiers flying off the shelves first, going out of stock almost immediately. On a store-by-store basis, we saw significant demand pattern shifts in Manhattan, migrating to stores in more residential areas as people began staying at home.
Now let’s look at cereal.

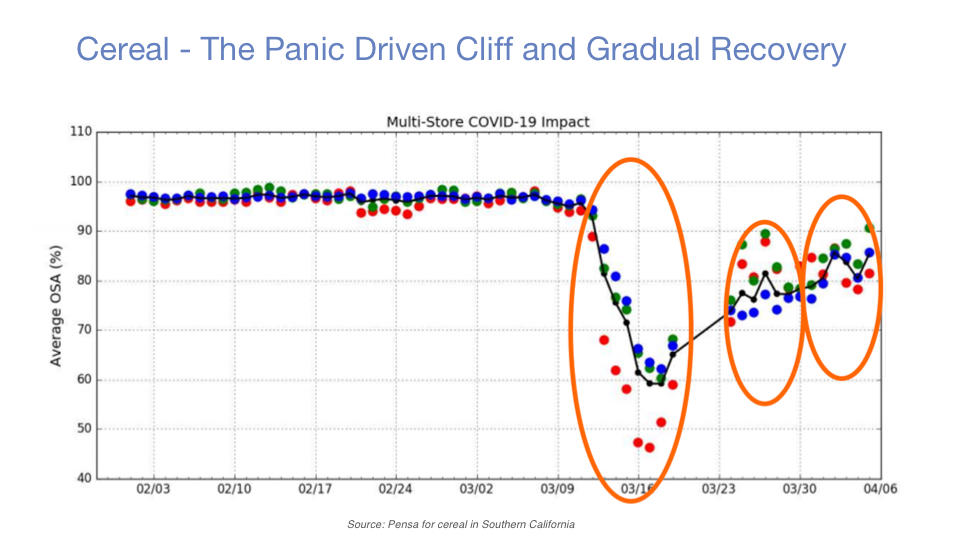
Above are the equivalent curves from suburban grocery stores in Southern California. In contrast to the steady gradual drop we saw in cough & cold in New York, here you can see the National Emergency Declaration on March 13 sparking immediate panic buying in the cereal aisle. As a result, product availability falls off a cliff, dropping 35 points in six days. The red dots represent OSA for top selling SKUs, which were hit even harder as consumers rushed to stock up on pantry staples.
In fact, our more detailed stock analysis saw dramatic changes in shelf assortments. Pre-COVID, shelves were stocked with a wide variety of cereal and granola brands. Overnight, we saw consumer preferences significantly shift toward core, top cereal brands, and moreover, almost exclusively toward the largest sizes or family-size options in each. This “shift to largest sized core products” is one we see across categories.
After the initial demand shock, you can see that after approximately a week, the supply chain begins to recover, as retailers worked with the largest brand manufacturers to allocate existing supplies and increase production of the more mainstream cereal brands.
You can see from the OSA percentages that the strategy is working. OSA for cereal is still a bit bumpy, but it’s clearly beginning to recover. Normal in-stock levels for cereal are about 95% or so. The bottom at the time fell to below 50%. In a series of fits and starts, the supply chain is recovering toward 80%. Not pre-COVID levels, but trending back up.
Finally, let’s look at cold beer.

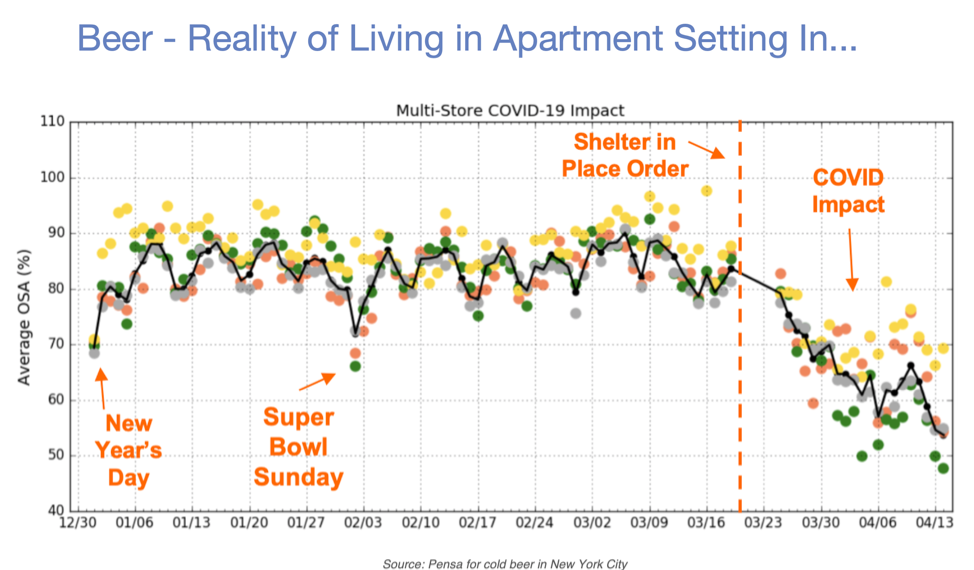
For context, the above chart reflects OSA percentages since the beginning of the year in New York City (the colored dots represent individual brands, which we can’t disclose; the dark line is the average). As the system reports clearly indicate, OSA low points in the beer category occur around the traditional big demand-driven events such as New Year’s Day and Super Bowl Sunday, before returning to more normal levels.
A similar, but sustained, low period was triggered when people were told to shelter in place; OSA for cold beer began a steady decline. Not panic buying or a dramatic emptying of the stores shelves so much as a steadily declining ability to keep beer in stock as consumers spend more time at home and therefore shift consumption that might normally take place elsewhere. That decline is continuing even to this day.
Our more detailed analysis also shows other changes in purchase patterns over this period. As seen in other categories, consumer demand turned to core staples, in this case, domestic beer brands, at the expense of imports and craft beers. Consumers also seemed to gravitate toward larger sized packs, presumably to limit trips to the store.
As you can see, consumer preferences and demands are shifting in dramatic ways – across the country, across categories, and changing day-by-day. Reacting to these changing preferences is key to optimizing supply chains and delivery runs.
Pensa continues to work with our retailer and manufacturer partners to deliver real-time visibility and week-to-week trend analysis for in-store OSA levels. From the retailer perspective, this “ground truth” for what is really on the shelves enables greater inventory system accuracy and facilitates optimizing the ordering process. From a manufacturer perspective, it enables critical visibility into shifting consumer demand preferences that helps guide forecasting, manufacturing and shipping routes.
We’re pleased to be able to help. Managing inventory is challenging enough in normal times, much less now, when few, if any, of the normal rules and models apply.
We want to express our gratitude and appreciation to all of the retailers and manufacturers, truckers, clerks, stockers and merchandisers who continue to work tirelessly and put their own health at risk to get products moving through the supply chain faster. The trend lines are moving in the right direction. Thank you for everything you’re doing.
We’ll continue to report on what we see moving forward.


